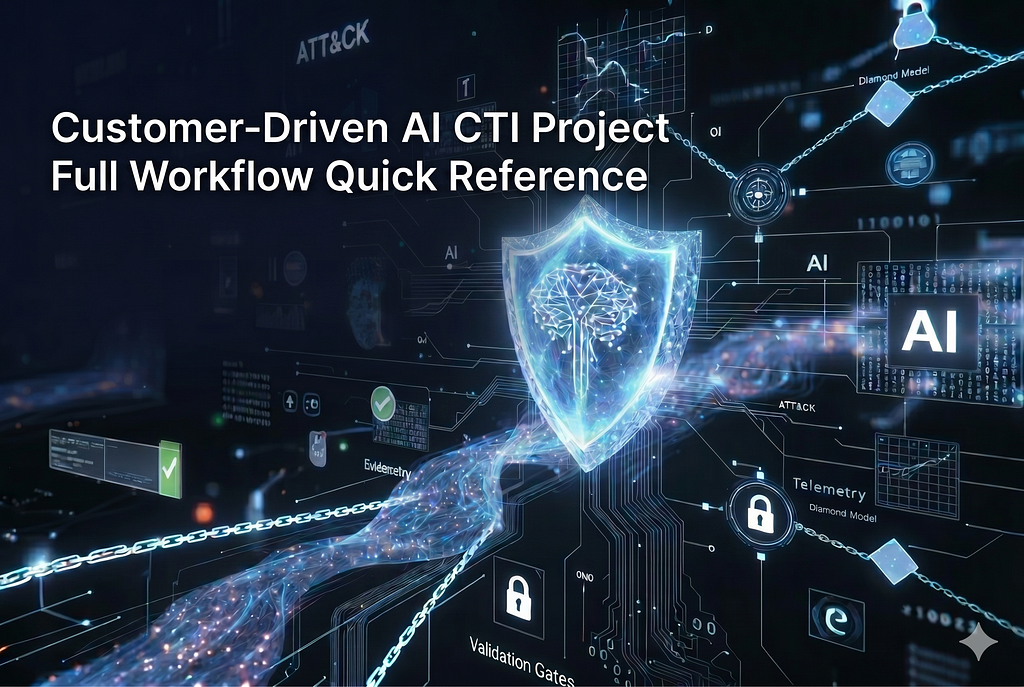
Customer-Driven AI CTI Project: Full Workflow Quick Reference
Most cyber threat intelligence programs fail at the same point: they produce reports nobody uses. For the underlying tradecraft standard, start with the CTI Analyst Field Manual. The analyst delivers a threat summary; the SOC ignores it; the CISO asks why the budget exists. The gap is not effort — it is structure. Intelligence that cannot be traced from a customer decision all the way to a fired detection rule, a tuned alert, and a measurable outcome is not intelligence. It is research.
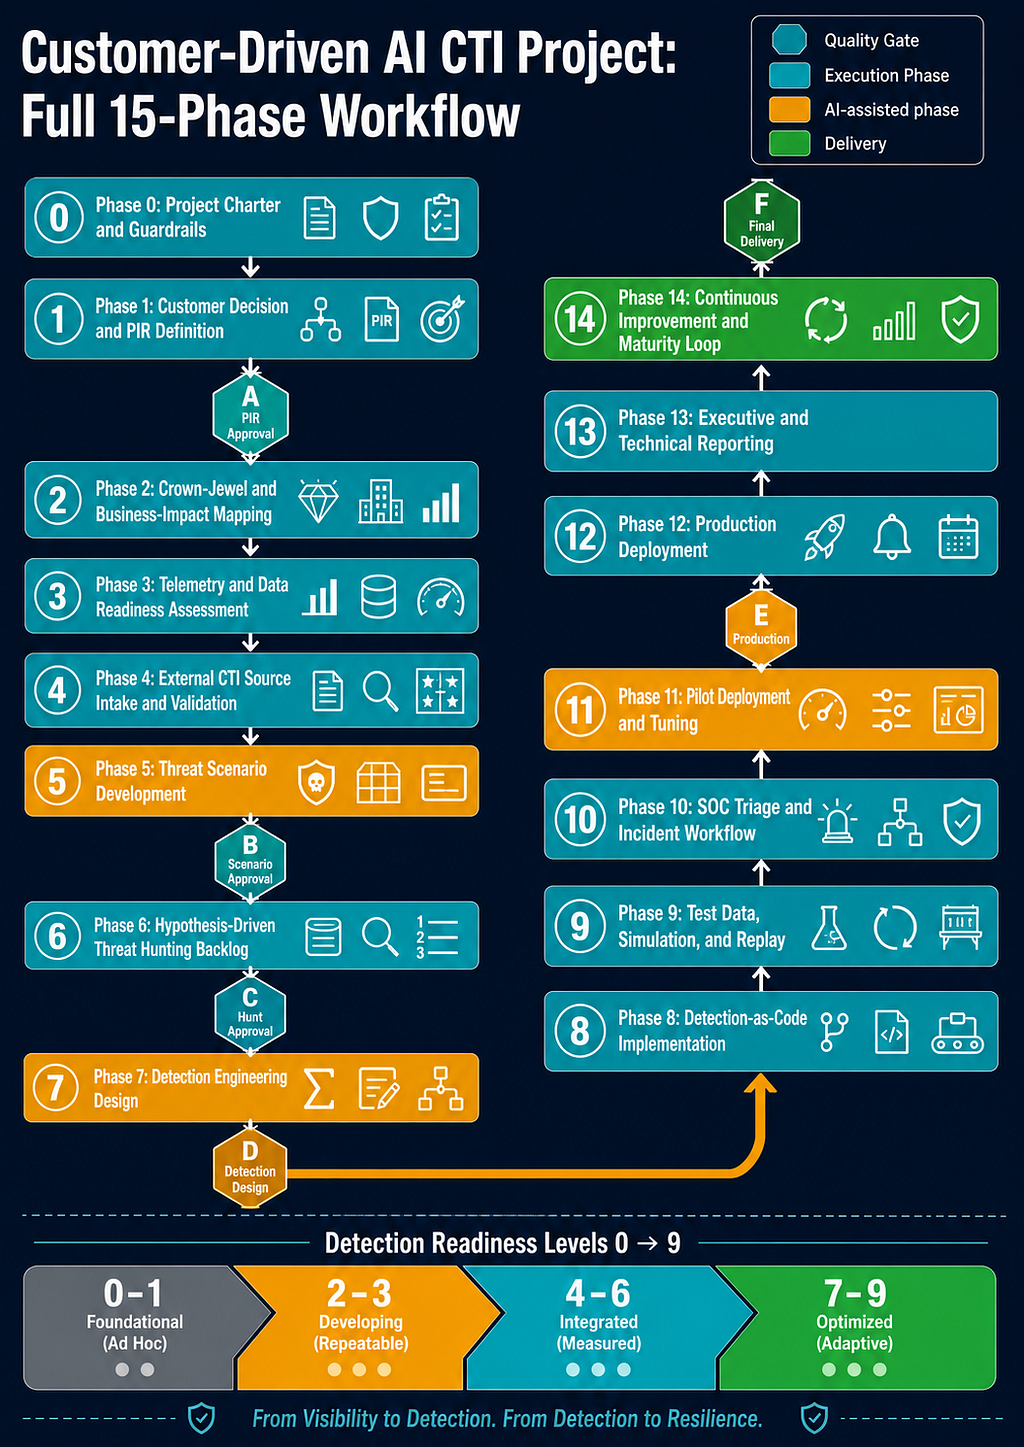
This project template exists to close that gap. It is a 15-phase, gate-controlled methodology for delivering CTI that ends in production detections, executive metrics, and a customer who can articulate exactly what changed in their security posture. AI accelerates every phase — source extraction, hypothesis generation, detection drafting, report writing — but the methodology enforces analytic discipline that no AI can shortcut: source rating, evidence labeling, confidence calibration, quality gate sign-off, and chain integrity from the first PIR to the last deliverable.
The project is published across three foundational articles and this workflow reference.
The Four Articles
Part 1: Foundations establishes the analytic standards the entire methodology depends on. Read it before anything else. It defines the Claim-to-Action Chain — the backbone that connects every source claim to a customer decision — and the vocabulary every phase uses: PIR and SIR format, Source Reliability using the Admiralty Code, Evidence Labels, Detection Readiness Levels, Threat Scenario Priority Scoring, Confidence Language, ATT&CK and D3FEND Mapping Quality, and the AI Governance Model that controls what AI can and cannot do at each phase.
Part 2A: Phase-by-Phase Execution Guide is the operational core. It walks all 15 phases in sequence — from Phase 0 (project charter and metric floors) through Phase 14 (continuous improvement loop) — with activities, register templates, allowed and prohibited AI actions, validation tests, exit criteria, and chain integrity requirements for each phase. If you are running a live project, Part 2A is your primary reference.
Part 2B: Reference Toolkit contains everything you pick up and use: ten AI Workflows with ready-to-run prompts, eleven Task Cards for structured human review, six Quality Gates with non-waivable and waivable blockers, all master register schemas, a complete worked example tracing one threat through the full chain, the 30/60/90-Day Execution Plan, and the Minimum Viable Customer Delivery checklist for time-constrained engagements.
This article is the quick-reference layer. It lists every phase as a numbered action checklist — no explanations, no background, just what to do and where to go. Every action links directly to the relevant section in Part 1, Part 2A, or Part 2B. Use it as your daily driver once you have read the foundational articles.
Read First (Once)
Claim-to-Action Chain · PIR and SIR Definitions · Source Reliability and Admiralty Code · Evidence Labels · Detection Readiness Levels · Threat Scenario Priority Scoring · Confidence Language · ATT&CK and D3FEND Mapping Quality · AI Governance Model
See also: Minimum Viable Customer Delivery · 30/60/90-Day Execution Plan
Phase 0: Project Charter and Guardrails
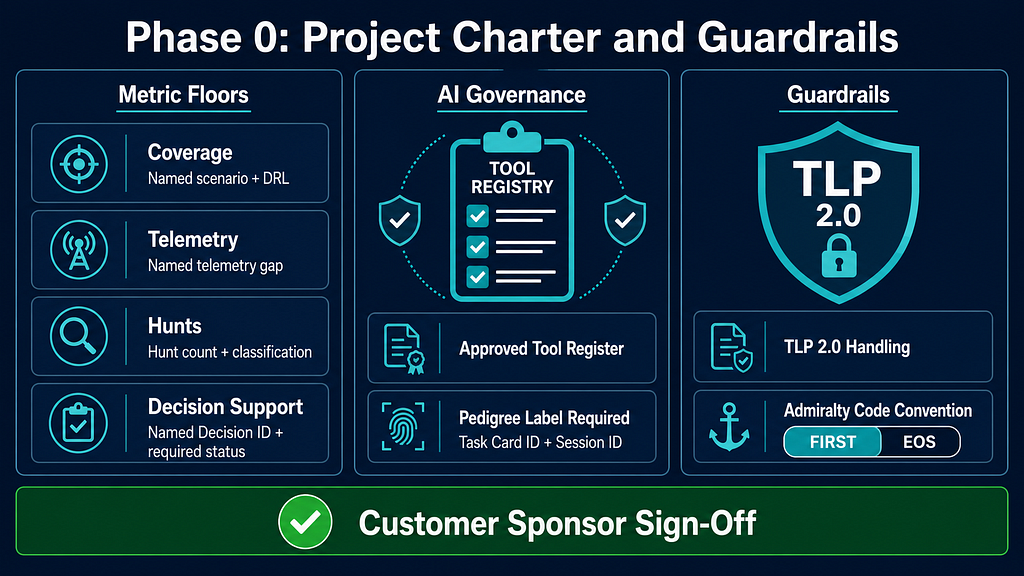
- Set success metric floors per Phase 0: coverage = named scenario + minimum DRL; telemetry = named gap; hunts = count + required classification; decisions = named Decision ID + required register status
- Define TLP 2.0 handling policy and data-sharing constraints
- List AI tools in use; require Task Card ID + AI Session ID on every AI-assisted output per Evidence Labels
- Document chosen Admiralty Code convention (FIRST: F = cannot be judged; or EOS: F = proven false) per Source Reliability
- Get customer sponsor sign-off on charter
Create a professional flat-design infographic titled "Phase 0: Project Charter and Guardrails" for a Cyber Threat Intelligence methodology. Layout: three equal columns. Column 1 "Metric Floors": four labeled floor cards — named scenario + DRL (coverage), named telemetry gap, hunt count + classification, named Decision ID + required status. Column 2 "AI Governance": tool registry icon, pedigree label requirement (Task Card ID + Session ID). Column 3 "Guardrails": TLP 2.0 shield icon, Admiralty Code convention selector (FIRST / EOS). Bottom bar: green checkmark labeled "Customer Sponsor Sign-Off". Color palette: dark navy #1a2744 background, teal #00bcd4 accents, white text, clean sans-serif. 16:9 format, no photorealistic elements, corporate security style.
Phase 1: Customer Decision and PIR Definition
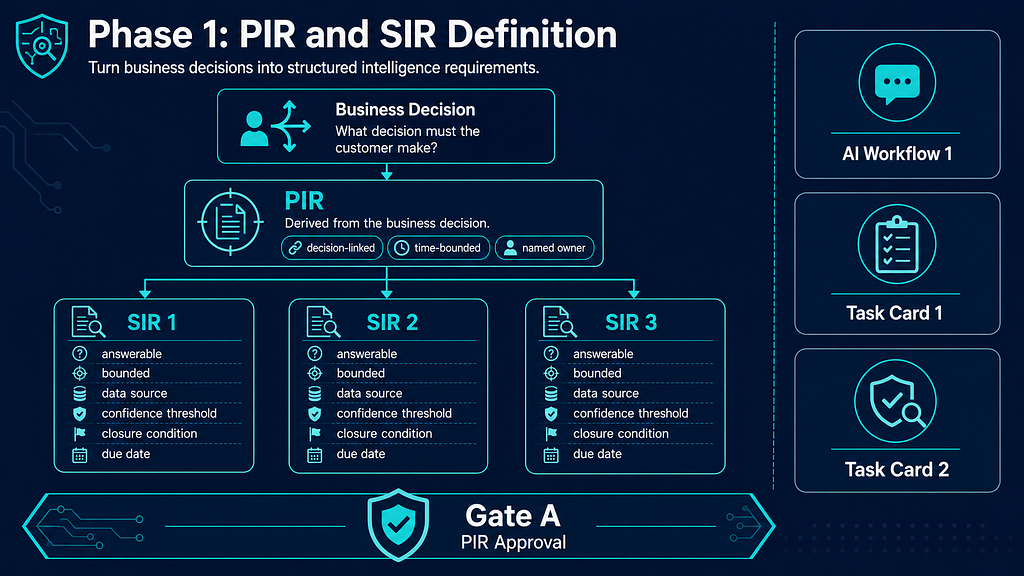
- Conduct customer kickoff; extract the business decisions the PIRs must support per PIR and SIR Definitions
- Draft PIRs in strong format: decision-linked, time-bounded, named customer owner
- Decompose each PIR into SIRs: answerable, bounded, named data source, evidence type, confidence threshold, owner, due date, closure condition
- Run AI Workflow 1: Source Extraction on highest-priority sources
- Complete Task Card 1: Source Claim Extraction
- Challenge PIR quality with Task Card 2: PIR Quality Challenge
- Submit evidence pack and pass Gate A: PIR Approval
Create a professional flat-design infographic titled "Phase 1: PIR and SIR Definition" for a CTI methodology. Show a top-down decomposition flow: "Business Decision" box at top → "PIR" card (attributes: decision-linked, time-bounded, named owner) → three "SIR" cards below (attributes: answerable, bounded, data source, confidence threshold, closure condition, due date). Right sidebar: AI Workflow 1 prompt icon, Task Card 1 checklist icon, Task Card 2 quality challenge icon. Bottom: Gate A badge labeled "PIR Approval". Color palette: dark navy #1a2744, teal #00bcd4, white. 16:9, flat vector style.
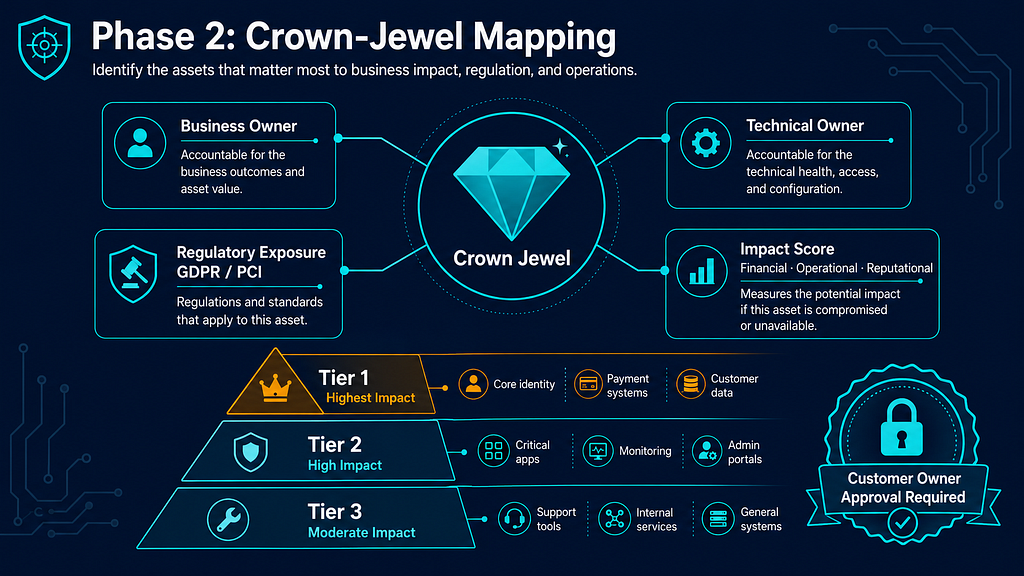
Phase 2: Crown-Jewel and Business-Impact Mapping
- List candidate crown jewels; assign business owner and technical owner to each
- Map regulatory and contractual exposure per asset (GDPR, PCI, sector-specific)
- Score business impact: financial, operational, reputational
- Run AI Workflow 2: Customer Relevance Mapping
- Complete Task Card 3: Crown-Jewel Dependency Review
- Get customer owner approval on final crown-jewel list (no self-classification)
Create a professional flat-design infographic titled "Phase 2: Crown-Jewel Mapping" for a CTI methodology. Center: a diamond/gem icon labeled "Crown Jewel" with four radiating attribute boxes: "Business Owner", "Technical Owner", "Regulatory Exposure (GDPR / PCI)", "Impact Score: Financial · Operational · Reputational". Below: a three-tier impact pyramid (Tier 1 highest impact at top, Tier 3 at base) with example asset types. Bottom right: "Customer Owner Approval Required" seal with lock icon. Color palette: dark navy #1a2744, teal #00bcd4, amber #f59e0b for high-impact tier, white text. 16:9, flat vector, no photos.
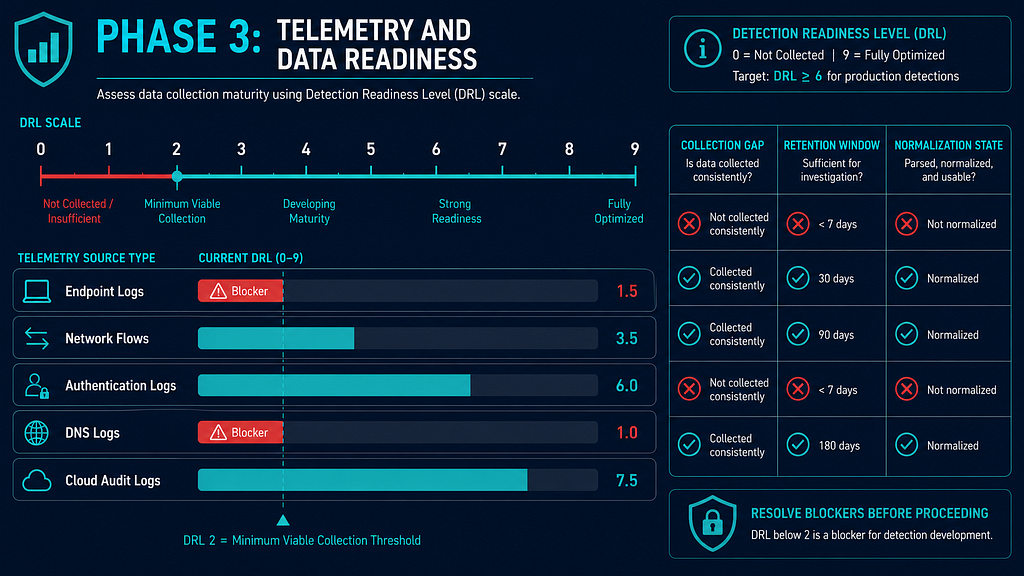
Phase 3: Telemetry and Data Readiness Assessment
- Inventory all telemetry sources against each crown-jewel system
- Assign Detection Readiness Level (DRL-0 to DRL-9) per observable type
- Document collection gaps, retention windows, and normalization state
- Run AI Workflow 2: Customer Relevance Mapping (telemetry coverage angle)
- Complete Task Card 4: Telemetry Feasibility Review
- Flag any SIR that has no telemetry source at DRL ≥ 2 as a blocker before Phase 5
Create a professional flat-design infographic titled "Phase 3: Telemetry and Data Readiness" for a CTI methodology. Main element: a horizontal DRL scale from 0 to 9. Below the scale: five rows of telemetry source types (endpoint logs, network flows, auth logs, DNS, cloud audit), each with a colored progress bar showing their current DRL. Bars below DRL 2 shown in red labeled "Blocker". Bars at DRL 2+ shown in teal. Right panel: three-column checklist — Collection Gap, Retention Window, Normalization State — with tick/cross icons. Color palette: dark navy #1a2744, teal for ready, red #ef4444 for gaps, white text. 16:9, flat vector.
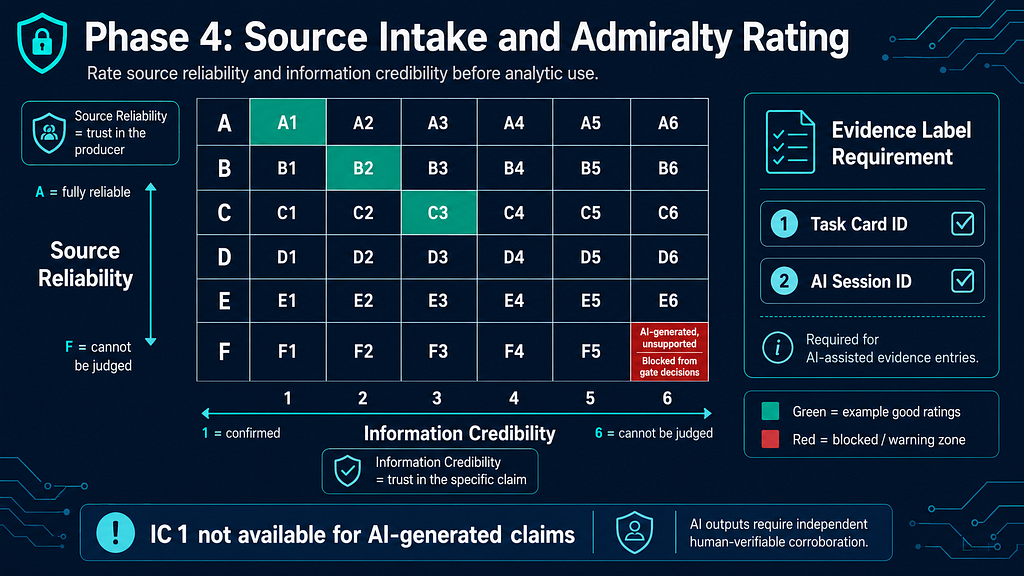
Phase 4: External CTI Source Intake and Validation
- Register each source in the Source Register with two-character combined Admiralty rating (e.g., B4, A1) per Source Reliability and Admiralty Code
- For AI-assisted output: verify traceable primary evidence; if none → rate F6, block from gate decisions; rate underlying source separately
- Attach Evidence Label (Task Card ID + AI Session ID) to every AI-assisted entry per Evidence Labels
- IC 1 (Confirmed) is not available for AI-generated claims
- Run AI Workflow 1: Source Extraction
- Complete Task Card 1: Source Claim Extraction
- Resolve all inter-rater disagreements > 1 letter or number before closing phase
Create a professional flat-design infographic titled "Phase 4: Source Intake and Admiralty Rating" for a CTI methodology. Main element: a 6x6 grid representing the Admiralty Code — Y axis labeled "Source Reliability" (A at top = fully reliable, F at bottom = cannot be judged), X axis labeled "Information Credibility" (1 at left = confirmed, 6 at right = cannot be judged). Highlight cell F6 in red labeled "AI-generated, unsupported — blocked from gate decisions". Highlight cells A1, B2, C3 in green as example good ratings. Right sidebar: Evidence Label requirement box (Task Card ID + AI Session ID). Bottom note: "IC 1 not available for AI-generated claims". Dark navy #1a2744, teal accents, red warning zone, white text. 16:9, flat vector.
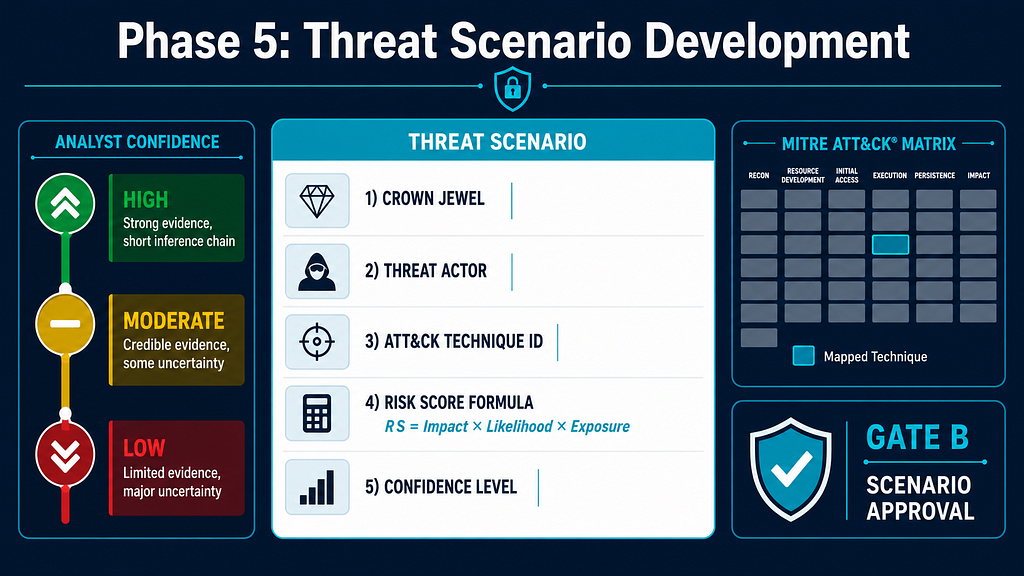
Phase 5: Threat Scenario Development
- Build one threat scenario per crown-jewel / SIR pair
- Compute Risk Score (RS) per Threat Scenario Priority Scoring
- Assign analyst confidence (High / Moderate / Low) per Confidence Language — note: "Likely" is probability language, not a confidence level; do not mix the two
- Map MITRE ATT&CK technique(s) per ATT&CK and D3FEND Mapping Quality
- Run AI Workflow 3: Threat Scenario Drafting
- Complete Task Card 5: Threat Scenario Builder
- Submit evidence pack and pass Gate B: Scenario Approval
Create a professional flat-design infographic titled "Phase 5: Threat Scenario Development" for a CTI methodology. Center: a scenario card template showing fields — Crown Jewel, Threat Actor, ATT&CK Technique ID, Risk Score formula (RS = Impact × Likelihood × Exposure), Confidence Level. Left sidebar: a vertical analyst confidence scale with three levels: High (dark green), Moderate (yellow), Low (red), each with one-line criteria. Right sidebar: ATT&CK matrix mini-icon with mapped technique highlighted, plus Gate B approval badge. Color palette: dark navy #1a2744, teal, traffic-light confidence scale, white text. 16:9, flat vector.
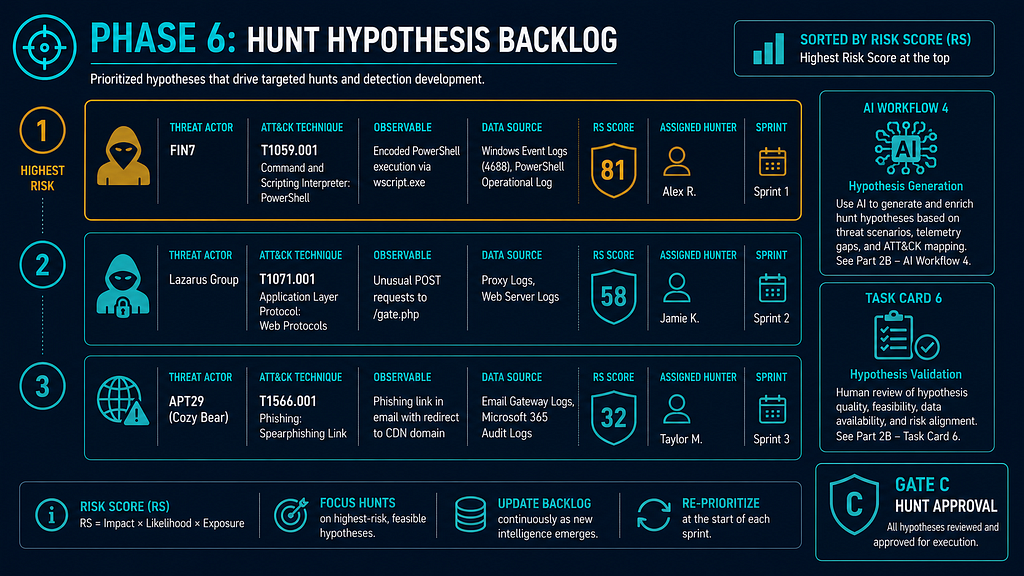
Phase 6: Hypothesis-Driven Threat Hunting Backlog
- Convert each threat scenario into a hunt hypothesis: actor, technique, observable, data source, expected artifact
- Prioritize backlog by RS score; assign to hunter with sprint target
- Run AI Workflow 4: Hunt Hypothesis Generation
- Complete Task Card 6: Hunt Hypothesis Generator
- Submit evidence pack and pass Gate C: Hunt Approval
Create a professional flat-design infographic titled "Phase 6: Hunt Hypothesis Backlog" for a CTI methodology. Main element: a vertical prioritized backlog of three hypothesis cards sorted by Risk Score (highest at top). Each card shows: Threat Actor, ATT&CK Technique, Observable, Data Source, RS score badge, assigned Hunter, Sprint label. Top card highlighted with amber border (highest RS). Right panel: AI Workflow 4 icon and Task Card 6 checklist icon. Bottom: Gate C badge labeled "Hunt Approval". Color palette: dark navy #1a2744, teal, amber #f59e0b for top-priority card, white text. 16:9, flat vector.
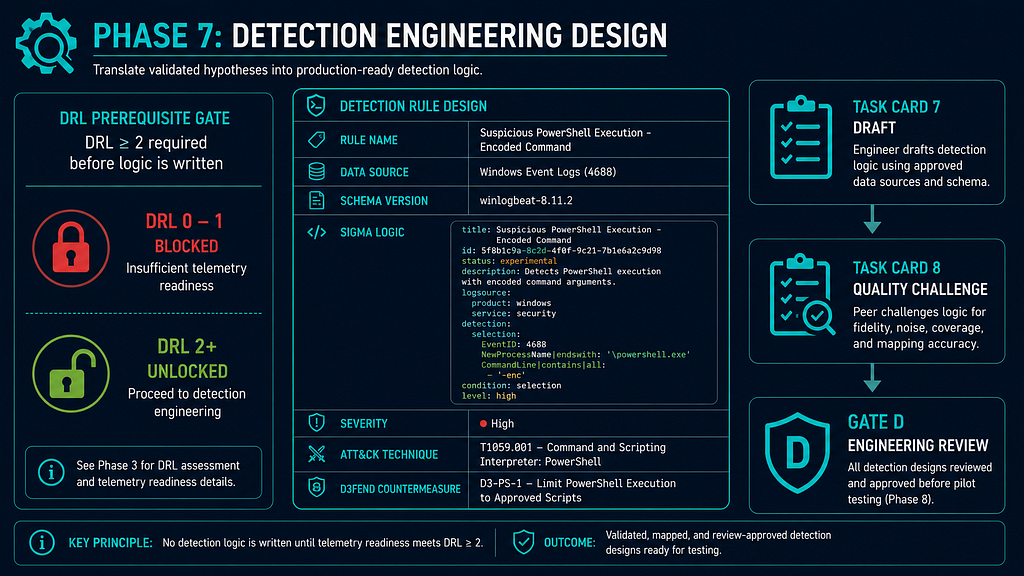
Phase 7: Detection Engineering Design
- Verify target DRL ≥ 2 before writing detection logic — no logic without telemetry
- Draft detection query or Sigma rule against named data source
- Map MITRE D3FEND countermeasure per ATT&CK and D3FEND Mapping Quality
- Record detection in Detection Backlog with schema version, data-source dependency, DRL, severity
- Run AI Workflow 5: Detection Drafting
- Complete Task Card 7: Detection Logic Draft
- Challenge logic with Task Card 8: Rule Quality Challenge
- Submit evidence pack and pass Gate D: Detection Design Approval
Create a professional flat-design infographic titled "Phase 7: Detection Engineering Design" for a CTI methodology. Left: a DRL prerequisite gate — "DRL ≥ 2 required before logic is written" with a red lock icon for DRL 0–1 and green unlock for DRL 2+. Center: a detection rule card showing fields — Rule Name, Data Source, Schema Version, Sigma logic snippet (monospace), Severity, ATT&CK technique, D3FEND countermeasure. Right: two-step review sequence — Task Card 7 (Draft) → Task Card 8 (Quality Challenge) → Gate D badge. Color palette: dark navy #1a2744, teal, green for unlocked state, white text. 16:9, flat vector.
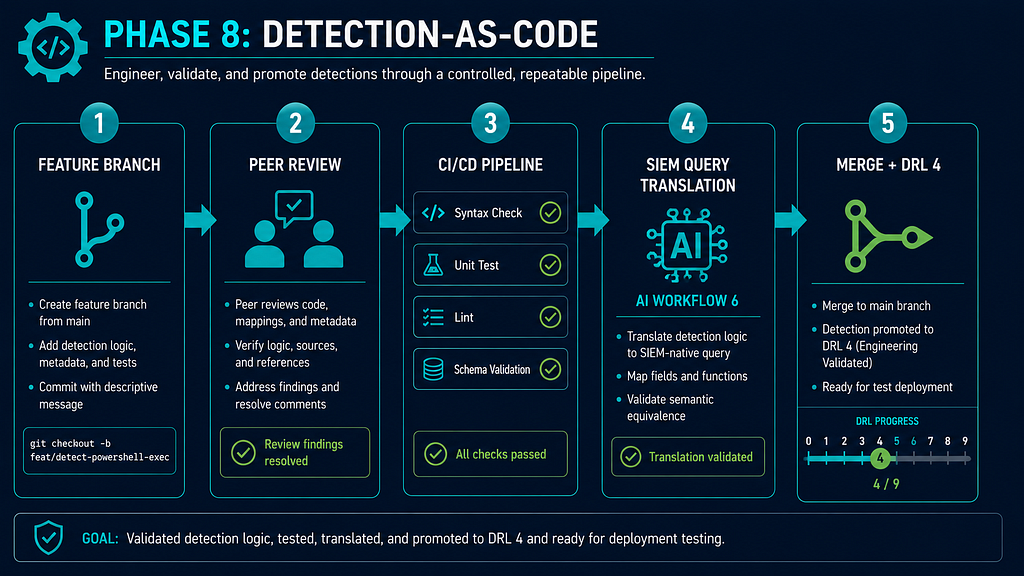
Phase 8: Detection-as-Code Implementation
- Commit detection rule to version-controlled repository (branch-per-rule pattern)
- Peer review by second engineer; resolve all review findings before merge
- Run CI/CD pipeline: syntax check, unit test, lint, schema validation
- Translate rule to target SIEM query per AI Workflow 6: Query Translation
- Advance DRL to 4 on successful merge and CI pass
Create a professional flat-design infographic titled "Phase 8: Detection-as-Code" for a CTI methodology. Show a horizontal pipeline flow with five stages connected by arrows: 1) "Feature Branch" (git branch icon) → 2) "Peer Review" (two-person icon, review findings resolved) → 3) "CI/CD Pipeline" (four sub-steps stacked: Syntax Check ✓, Unit Test ✓, Lint ✓, Schema Validation ✓) → 4) "SIEM Query Translation" (AI Workflow 6 icon) → 5) "Merge + DRL 4" (green merge icon, DRL progress bar at 4/9). Color palette: dark navy #1a2744, teal pipeline connectors, green checkmarks, white text. 16:9, flat vector.
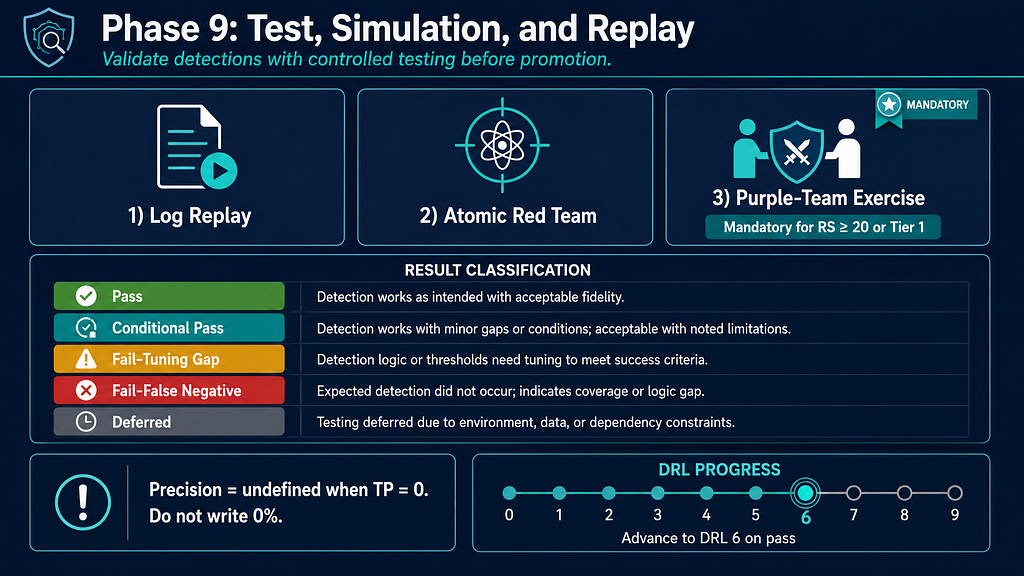
Phase 9: Test Data, Simulation, and Replay
- Obtain or generate test dataset: real log replay, atomic red team, or purple-team exercise
- RS ≥ 20 or Tier 1 crown jewels → purple-team exercise is mandatory; log result in Purple-Team Test Register
- Run AI Workflow 7: Test Case Generation
- Challenge test coverage with Task Card 8: Rule Quality Challenge
- Record result per detection: Pass / Conditional pass / Fail-tuning gap / Fail-false negative / Deferred
- Pilot precision is undefined (not zero) when TP = 0 — do not record "0% precision"
- Log any false negatives in False-Negative Register; log D3FEND countermeasures in D3FEND Mapping Register
- Advance DRL to 6 on test pass
Create a professional flat-design infographic titled "Phase 9: Test, Simulation, and Replay" for a CTI methodology. Top section: three test track icons side by side — "Log Replay", "Atomic Red Team", "Purple-Team Exercise" (the third marked with a mandatory flag for RS ≥ 20 or Tier 1). Center: a result classification legend with five color-coded rows — Pass (green), Conditional Pass (teal), Fail-Tuning Gap (amber), Fail-False Negative (red), Deferred (grey). Bottom left callout box: "Precision = undefined when TP = 0. Do not write 0%." Bottom right: DRL progress bar advancing to 6 on pass. Dark navy #1a2744, traffic-light result colors, white text. 16:9, flat vector.
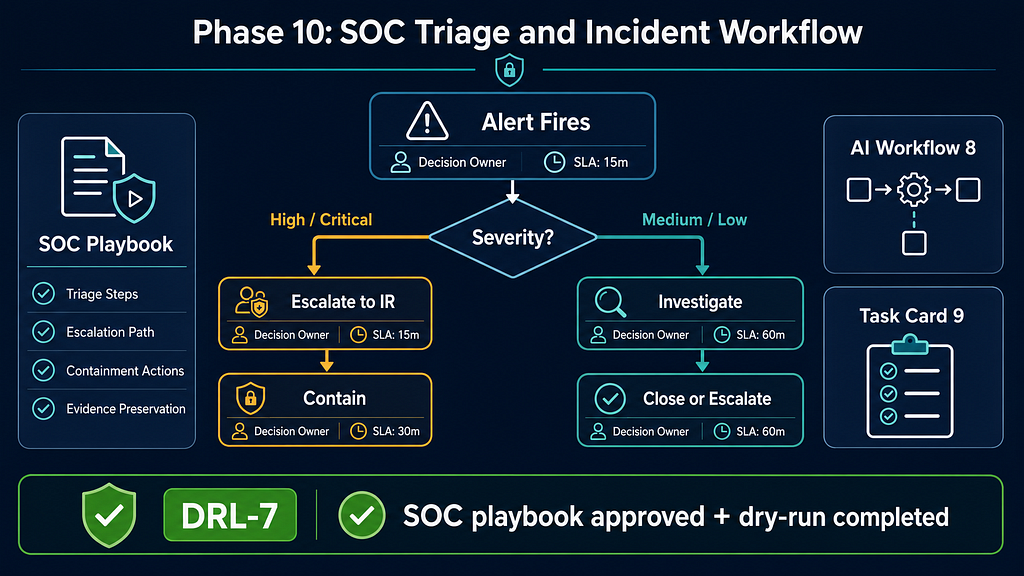
Phase 10: SOC Triage and Incident Workflow
- Draft SOC playbook: triage steps, escalation path, containment actions, evidence preservation
- Define alert severity mapping and SLA thresholds
- Map each alert to a decision owner and an IR escalation contact
- Run AI Workflow 8: SOC Playbook Drafting
- Complete Task Card 9: SOC Playbook Draft
- Conduct SOC dry-run against the detection; advance DRL to 7 after playbook approved and dry-run completed per Detection Readiness Levels
Create a professional flat-design infographic titled "Phase 10: SOC Triage and Incident Workflow" for a CTI methodology. Main element: a vertical decision tree — "Alert Fires" at top → diamond "Severity?" with two branches: High/Critical (left, amber border) → "Escalate to IR" → "Contain"; Medium/Low (right) → "Investigate" → "Close or Escalate". Each node shows: Decision Owner icon, SLA timer icon. Left sidebar: SOC Playbook card showing fields — Triage Steps, Escalation Path, Containment Actions, Evidence Preservation. Right sidebar: AI Workflow 8 and Task Card 9 icons. Bottom bar: dry-run completion step with DRL-7 badge labeled "SOC playbook approved + dry-run completed". Dark navy #1a2744, teal, amber for high-severity path, green for DRL-7 badge, white text. 16:9, flat vector.
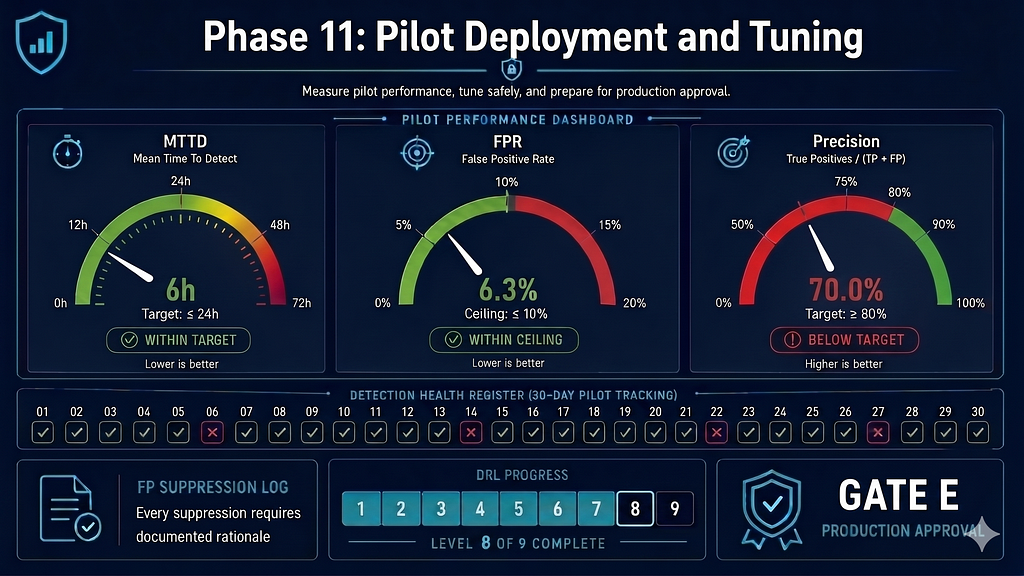
Phase 11: Pilot Deployment and Tuning
- Deploy rule to pilot scope (limited asset set or log volume)
- Measure MTTD, FPR, precision; compare against Phase 0 floor targets
- Document each FP suppression with rationale; no undocumented tuning
- Record Detection Health Register entries daily during pilot window
- Advance DRL to 8 on pilot pass (pilot completed + tuning decision documented) per Detection Readiness Levels
- Submit evidence pack and pass Gate E: Production Approval
Create a professional flat-design infographic titled "Phase 11: Pilot Deployment and Tuning" for a CTI methodology. Main element: a metrics dashboard with three circular gauge dials — MTTD (with target floor line), FPR (with ceiling line), Precision — each showing green if within target, red if breached. Below gauges: a daily log strip labeled "Detection Health Register" with 30 tick marks. Bottom left: "FP Suppression Log — every suppression requires documented rationale". Bottom right: DRL progress bar at 8 and Gate E badge "Production Approval". Dark navy #1a2744, teal, green/red for gauge status, white text. 16:9, flat vector dashboard style.
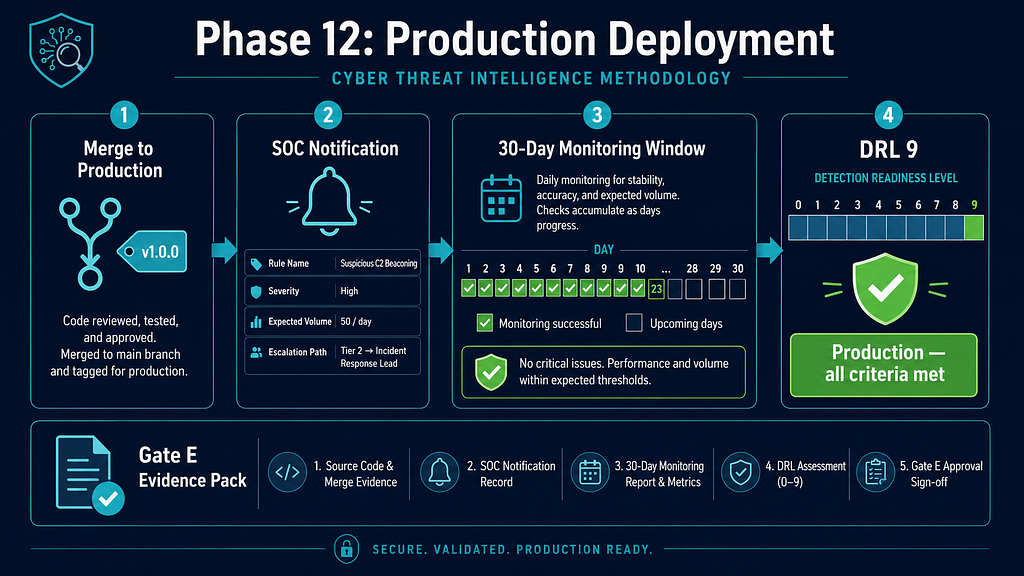
Phase 12: Production Deployment
- Merge detection to production branch; tag release
- Notify SOC: rule name, severity, expected alert volume, escalation path
- Start 30-day monitoring window per 30/60/90-Day Execution Plan
- Confirm Gate E: Production Approval evidence pack is filed
- Advance DRL to 9 after sustained production pass: owner assigned, monitoring active, review date set, rollback and health tracking confirmed per Detection Readiness Levels
Create a professional flat-design infographic titled "Phase 12: Production Deployment" for a CTI methodology. Show a four-stage horizontal pipeline: 1) "Merge to Production" (git tag icon) → 2) "SOC Notification" (bell icon, fields: rule name, severity, expected volume, escalation path) → 3) "30-Day Monitoring Window" (calendar strip with 30 daily squares, green checks accumulating) → 4) "DRL 9" (full DRL bar, final segment highlighted green labeled "Production — all criteria met"). Bottom: Gate E evidence pack file icon. Color palette: dark navy #1a2744, teal pipeline arrows, green production-ready DRL, white text. 16:9, flat vector.
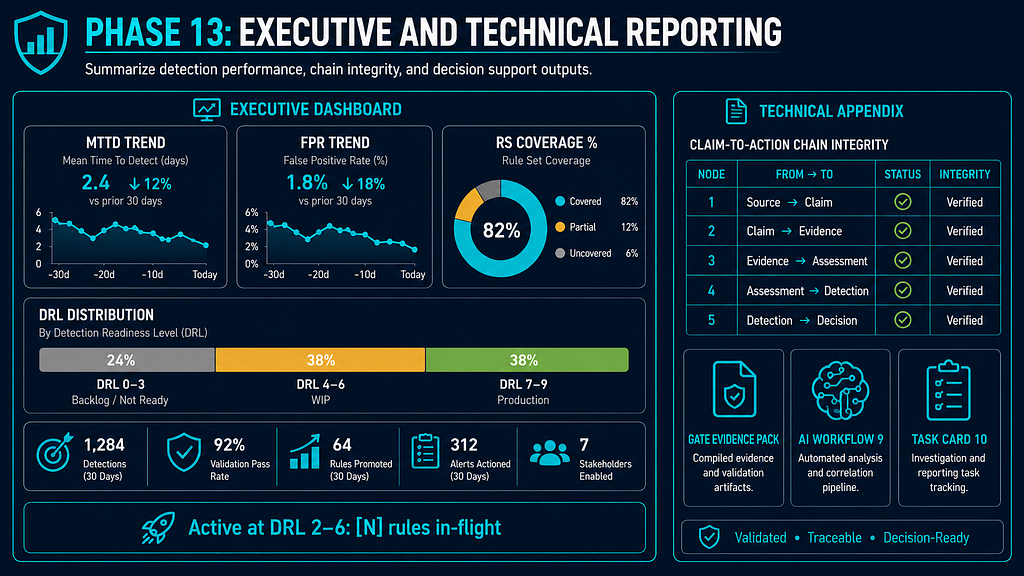
Phase 13: Executive and Technical Reporting
- Compute metrics: MTTD, FPR, precision, RS coverage %, DRL distribution across all active detections
- Record WIP metric: count of active detections at DRL 2–6 (in-flight, not yet production-ready)
- Draft executive report: business impact, threat coverage, open gaps, next-quarter priorities
- Draft technical appendix: Claim-to-Action Chain integrity table, DRL table, gate evidence pack
- Run AI Workflow 9: Report Drafting
- Complete Task Card 10: Executive Report Draft
Create a professional flat-design infographic titled "Phase 13: Executive and Technical Reporting" for a CTI methodology. Split layout, left two-thirds "Executive Dashboard": MTTD trend sparkline, FPR trend sparkline, RS Coverage % donut chart, DRL Distribution horizontal stacked bar (DRL 0–3 grey, DRL 4–6 amber WIP, DRL 7–9 green production). Prominent WIP callout: "Active at DRL 2–6: [N] rules in-flight". Right one-third "Technical Appendix": Claim-to-Action Chain integrity table excerpt (5 nodes), gate evidence pack icon, AI Workflow 9 and Task Card 10 icons. Dark navy #1a2744, teal, data visualization style, white text. 16:9, flat vector.
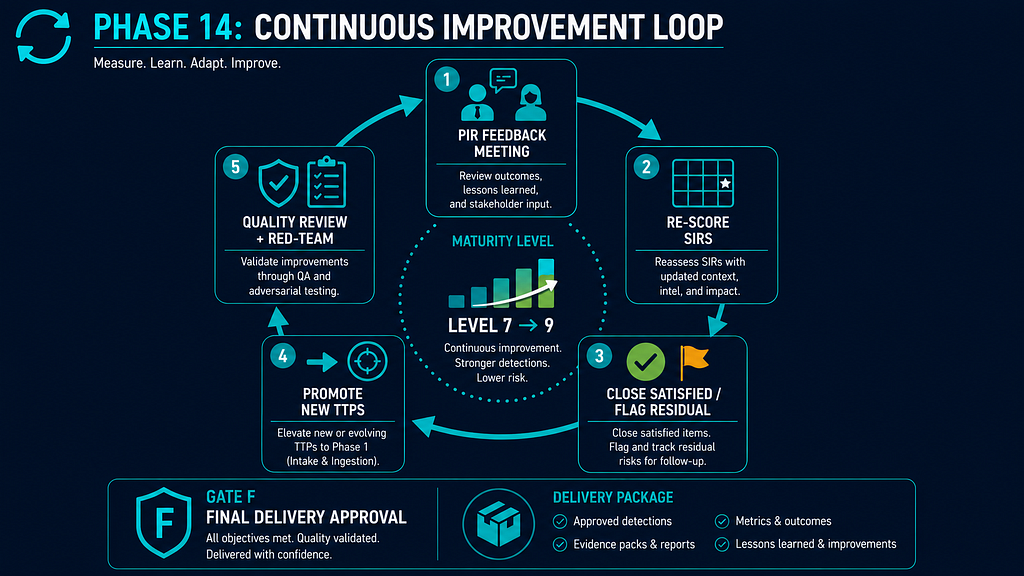
Phase 14: Continuous Improvement and Maturity Loop
- Conduct PIR Feedback Loop meeting with customer; re-score open SIRs
- Close satisfied SIRs with evidence; document residual risk for unsatisfied SIRs
- Promote new threat actor TTPs to Phase 1 intake queue
- Run AI Workflow 10: Quality Review
- Complete Task Card 11: Final Red-Team Review; resolve all Critical and High findings before Gate F
- Submit evidence pack and pass Gate F: Final Delivery Approval
- Deliver Final Customer Delivery Package
Create a professional flat-design infographic titled "Phase 14: Continuous Improvement Loop" for a CTI methodology. Main element: a circular loop diagram with five nodes connected by curved arrows going clockwise: 1) "PIR Feedback Meeting" (customer + analyst icon) → 2) "Re-score SIRs" (scoring matrix icon) → 3) "Close Satisfied / Flag Residual" (green tick / amber flag) → 4) "Promote New TTPs" (arrow pointing to Phase 1 intake icon) → 5) "Quality Review + Red-Team" (Task Card 11 shield icon). Center of the circle: maturity level indicator rising. Bottom: Gate F badge "Final Delivery Approval" and delivery package icon. Dark navy #1a2744, teal loop arrows, green/amber status icons, white text. 16:9, flat vector.
Quality Gates
- Gate A: PIR Approval — after Phase 1 → Gate A
- Gate B: Scenario Approval — after Phase 5 → Gate B
- Gate C: Hunt Approval — after Phase 6 → Gate C
- Gate D: Detection Design — after Phase 7 → Gate D
- Gate E: Production — after Phase 11–12 → Gate E
- Gate F: Final Delivery — after Phase 14 → Gate F
Master Registers
- PIR / SIR Register — Phase 1 → Phase 1
- Crown-Jewel Register — Phase 2 → Phase 2
- Telemetry Register — Phase 3 → Phase 3
- Source Register — Phase 4 → Phase 4
- Threat Scenario Register — Phase 5 → Phase 5
- Hunt Backlog — Phase 6 → Phase 6
- Detection Backlog — Phase 7 → Phase 7
- Detection Coverage Gap Register — Phase 7 → Phase 7
- D3FEND Mapping Register — Phase 7 → Phase 7
- Purple-Team Test Register — Phase 9 → Phase 9
- False-Negative Register — Phase 9 → Phase 9
- Detection Health Register — Phase 11 → Phase 11
- Final Delivery Package — Phase 14 → Phase 14
AI Workflows
- AI Workflow 1: Source Extraction — Phases 1 and 4
- AI Workflow 2: Customer Relevance Mapping — Phases 2 and 3
- AI Workflow 3: Threat Scenario Drafting — Phase 5
- AI Workflow 4: Hunt Hypothesis Generation — Phase 6
- AI Workflow 5: Detection Drafting — Phases 7 and 8
- AI Workflow 6: Query Translation — Phase 8
- AI Workflow 7: Test Case Generation — Phase 9
- AI Workflow 8: SOC Playbook Drafting — Phase 10
- AI Workflow 9: Report Drafting — Phase 13
- AI Workflow 10: Quality Review — Phase 14
Task Cards
- Task Card 1: Source Claim Extraction — Phases 1 and 4
- Task Card 2: PIR Quality Challenge — Phase 1
- Task Card 3: Crown-Jewel Dependency Review — Phase 2
- Task Card 4: Telemetry Feasibility Review — Phase 3
- Task Card 5: Threat Scenario Builder — Phase 5
- Task Card 6: Hunt Hypothesis Generator — Phase 6
- Task Card 7: Detection Logic Draft — Phase 7
- Task Card 8: Rule Quality Challenge — Phases 7 and 9
- Task Card 9: SOC Playbook Draft — Phase 10
- Task Card 10: Executive Report Draft — Phase 13
- Task Card 11: Final Red-Team Review — Phase 14